How to install and configure Grafana and Prometheus on Debian 12
What is Grafana?
Grafana is an open-source visualization and analytics software. It allows you to query, visualize, alert, and explore your metrics, logs and traces no matter where they are stored. It provides you with tools to turn your time-series database (TSDB) data into insightful graphs and visualizations.
What is Prometheus?
Prometheus is an open-source monitoring system with a dimensional data model, flexible query language, efficient time series database, and modern alerting approach.
Read more: How to install and configure Grafana and Prometheus on Debian 12Step 1. Install Grafana on Debian
This topic explains how to install Grafana dependencies, install Grafana on Linux Debian, and start the Grafana server on your Debian system.
There are multiple ways to install Grafana: using the Grafana Labs APT repository, downloading a .deb package, or downloading a binary .tar.gz file.
I prefer to install it from the Grafana Labs APT repository because if you select install via the .deb package or .tar.gz file, you must manually update Grafana for each new version.
Complete the following steps to install Grafana from the APT repository:
1. Install the prerequisite packages:
apt-get install -y apt-transport-https software-properties-common wget2. Import the GPG key:
mkdir -p /etc/apt/keyrings/
wget -q -O - https://apt.grafana.com/gpg.key | gpg --dearmor | tee /etc/apt/keyrings/grafana.gpg > /dev/null
3. To add a repository for stable releases, run the following command:
echo "deb [signed-by=/etc/apt/keyrings/grafana.gpg] https://apt.grafana.com stable main" | tee -a /etc/apt/sources.list.d/grafana.list4. Run the following command to update the list of available packages:
apt-get update5. To install Grafana OSS, run the following command:
apt-get install grafanaStep 2. Start the Grafana Server
Complete the following steps to start the Grafana server using systemd and verify it is running.
To start the service, run the following commands:
systemctl start grafana-server
systemctl status grafana-server
To verify that the service is running, run the following command:
systemctl status grafana-serverStep 3. Configure the Grafana server to start at boot using systemd
To configure the Grafana server to start at boot, run the following command:
systemctl enable grafana-server.serviceStep 4. Sign in to Grafana
To sign in to Grafana for the first time:
1. Open your web browser and go to http://localhost:3000. The default HTTP port that Grafana listens to is 3000 unless you have configured a different port.
2. On the sign-in page, enter admin for both the username and password.
3. Click Sign in. If successful, you’ll see a prompt to change the password.
4. Click OK on the prompt and change your password.
Note: We strongly recommend that you change the default administrator password.
Step 5. Run Grafana behind a reverse proxy
When running Grafana behind a proxy, you need to configure the domain name to let Grafana know how to render links and redirects correctly.
In the Grafana configuration file /etc/grafana/grafana.ini, change the domain to the domain name you’ll be using:
# The public facing domain name used to access grafana from a browser
;domain = localhost
Restart Grafana for the new changes to take effect.
systemctl restart grafana-serverNginx configuration example
upstream grafana {
  server localhost:3000;
}

server {
    listen 80;
    #listen 443 ssl;

    root /var/www/grafana;
    index index.html index.htm index.nginx-debian.html;

    server_name grafana.localhost;

    #ssl_certificate     /etc/letsencrypt/live/grafana.localhost/fullchain.pem;
    #ssl_certificate_key /etc/letsencrypt/live/grafana.localhost/privkey.pem;

    location / {
        proxy_set_header Host $http_host;
        proxy_pass http://grafana;
    }
}
Reload the NGINX configuration via the command line:
/etc/init.d/nginx reloadNavigate to port 80 on the machine NGINX is running on. The Grafana login page greets you.
Step 6. Install Prometheus on Debian
To install Prometheus, follow these steps:
1. Run the following command to update the list of available packages:
apt-get update2. To install Prometheus, run the following command:
apt-get install prometheus3. Verify that Prometheus is successfully installed using the below command:
prometheus --version4. The command will output the following information:
prometheus, version 2.42.0+ds (branch: debian/sid, revision: 2.42.0+ds-5+b5)
  build user:       [email protected]
  build date:       20230518-08:49:35
  go version:       go1.19.8
  platform:         linux/amd64
5. Use systemctl enable to configure the Prometheus service to start when the system boots automatically. If this command is not added, Prometheus must be launched manually.
systemctl enable prometheus6. Start the Prometheus service and review the status command to ensure it is active.
systemctl start prometheus
systemctl status prometheus
7. Access the Prometheus web interface and dashboard at http://local_ip_addr:9090. Replace local_ip_addr with the address of the monitoring server. Because Prometheus uses the default configuration file, it does not display much information yet.
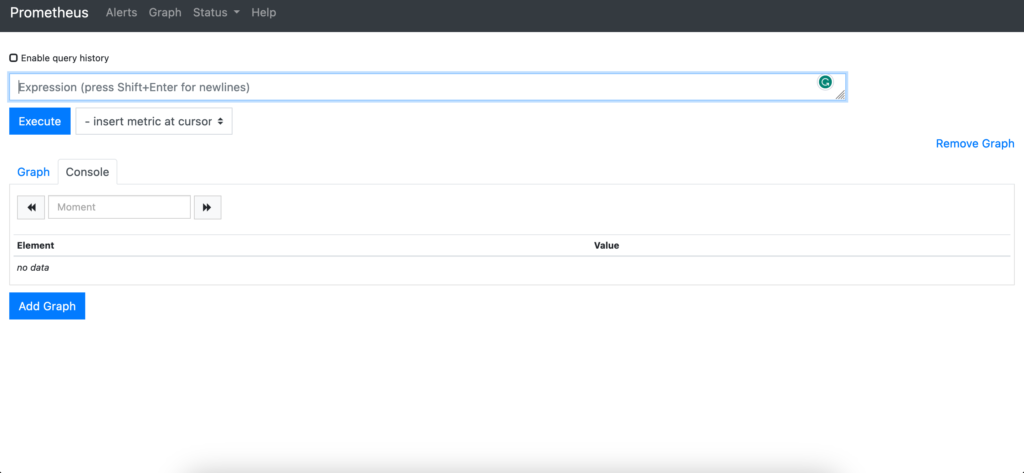
8. The default prometheus.yml file contains a directive to scrape the local host. Click Status and Targets to list all the targets. Prometheus should display the local Prometheus service as the only target.
Step 7. Install and configure Node Exporter on the client
Before a remote system can be monitored, it must have some client to collect the statistics. Several third-party clients are available. However, for ease of use, Prometheus recommends the Node Exporter client. After Node Exporter is installed on a client, the client can be added to the list of servers to scrape in prometheus.yml.
To install Node Exporter, follow these steps. Repeat these instructions for every client.
1. Run the following command to update the list of available packages:
apt-get update2. To install Node Exporter, run the following command:
apt-get install prometheus-node-exporter3. If you intend to monitor the client continuously, use the systemctl enable command to launch Node Exporter automatically at boot time. This continually exposes the system metrics on port 9100. If Node Exporter is only intended for occasional use, do not use the command below.
systemctl enable prometheus-node-exporter4. Start Node Exporter and verify its status. The service should be active.
systemctl start prometheus-node-exporter
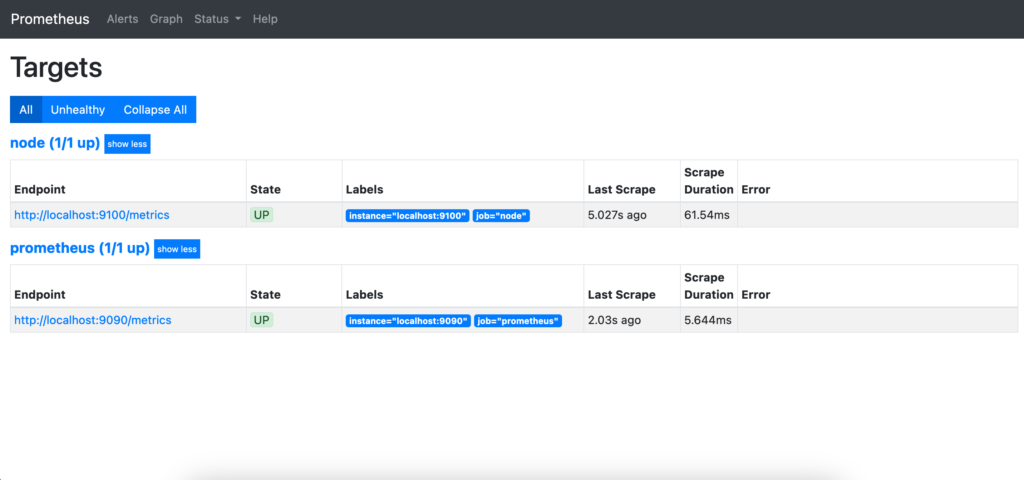
systemctl status prometheus-node-exporter5. Use a web browser to visit port 9100 on the client node, for example, http://local_ip_addr:9100. A page entitled Node Exporter is displayed along with a link reading Metrics. Click the Metrics link and confirm the statistics are being collected. For a detailed explanation of the various statistics, see the Node Exporter Documentation.
Step 8. Configure Prometheus to monitor client nodes
The client nodes are now ready for monitoring. To add clients to prometheus.yml, follow the steps below:
1. On the monitoring server running Prometheus, open prometheus.yml for editing.
nano /etc/prometheus/prometheus.yml2. Locate the section entitled scrape_configs, which contains a list of jobs. It currently lists a single job named prometheus. This job monitors the local Prometheus task on the port 9090. Beneath the prometheus job, add a second job having the job_name of remote_collector. Include the following information.
- A
scrape_intervalof10s. - Inside
static_configsin thetargetsattribute, add a bracketed list of the IP addresses to monitor. Separate each entry using a comma. - Append the port number
:9100to each IP address. - To enable monitoring of the local server, add an entry for
localhost:9100to the list.
The entry should resemble the following example. Replace remote_addr with the actual IP address of the client.
scrape_configs:
  ...
  - job_name: "remote_collector"
    scrape_interval: 10s
    static_configs:
      - targets: ["remote_addr:9100"]
3. To immediately refresh Prometheus, restart the prometheus service.
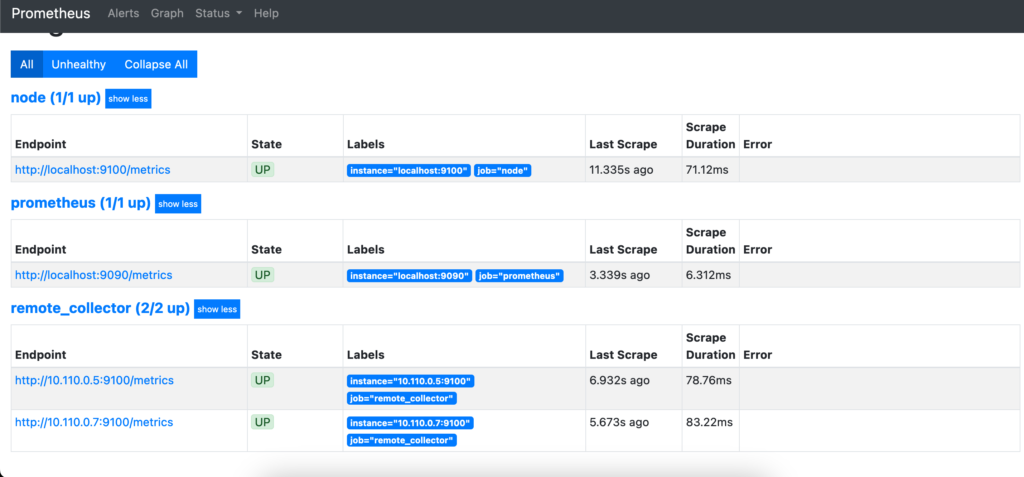
systemctl restart prometheus4. Using a web browser, revisit the Prometheus web portal at port 9090 on the monitoring server. Select Status and then Targets. A second link for the remote_collector job is displayed, leading to port 9100 on the client. Click the link to review the statistics.
Step 9. Integrate Grafana and Prometheus
All system components are now installed, but Grafana and Prometheus are not set up to interact. The remaining configuration tasks, including adding Prometheus as the data source and importing a dashboard panel, can be accomplished using the Grafana web interface.
To integrate Grafana and Prometheus, follow the steps below:
1. Using a web browser, visit port 3000 of the monitoring server. For example, enter http://local_ip_addr:3000, replacing local_ip_addr with the actual IP address. Grafana displays the login page. Use the user name admin and the default password password. Change the password to a more secure value when prompted to do so.
2. After a successful password change, Grafana displays the Grafana Dashboard.
3. To add Prometheus as a data source, click Connections and select Add New Connection.
4. In Data Sources, choose Prometheus as the data source.
5. As described in this guide, set the URL to http://localhost:9090 for a local Prometheus source. Most of the other settings can remain at the default values. However, a non-default timeout value can be added here.
6. When satisfied with the settings, select the save & test button at the bottom of the screen.
7. Grafana confirms the Data source is working if all settings are correct.
Step 10. Import a Grafana Dashboard
- A dashboard displays statistics for the client node using a more effective and standardized layout. It is certainly possible to create a custom dashboard. However, Prometheus has already made a dashboard to support the Node Exporter statistics. The Node Exporter Full dashboard neatly graphs most of the values collected from the client nodes. Importing this premade dashboard is much less work than creating a custom one.
To import the Node Exporter dashboard, follow the steps below:
1. Visit the Grafana Dashboard Library. Enter Node exporter as the search term.
2. Select the entry for Node Exporter Full.
3. Make a note of the ID number or use the button to copy the ID to the clipboard. The ID of this board is currently 1860.
4. Return to the Grafana dashboard. Select the Dashboard icon, consisting of four squares.
5. Click the Create Dashboard button and choose Import a Dashboard.
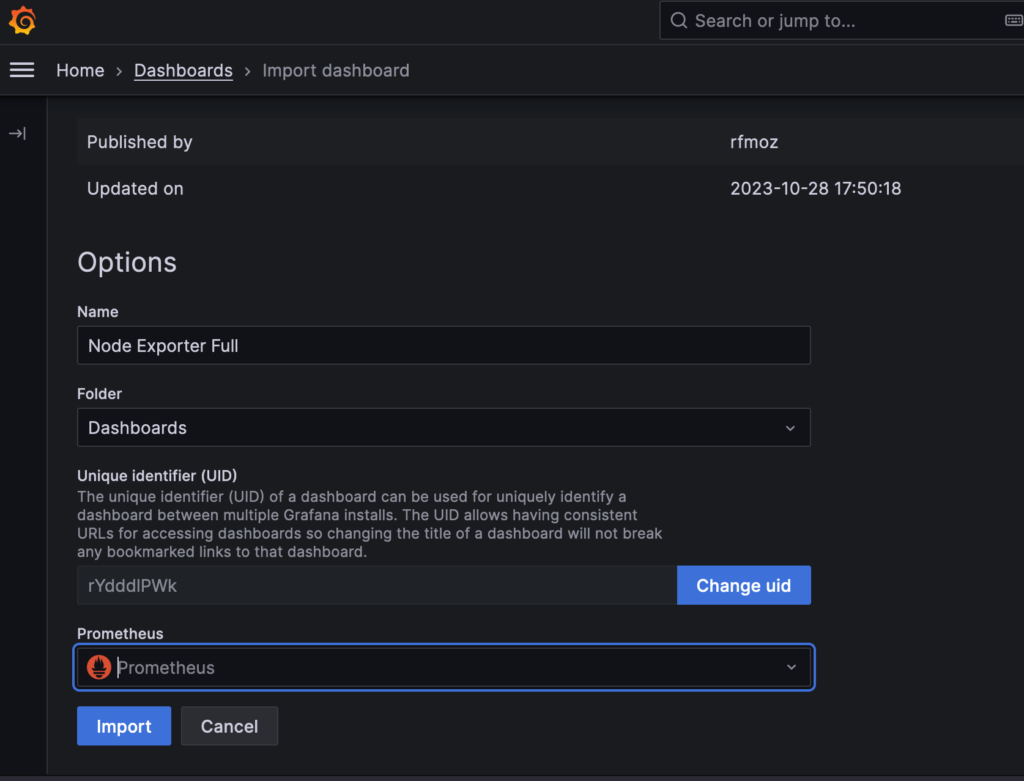
6. In the Import via grafana.com box, enter the ID 1860 from the previous step. Then select the Load button.
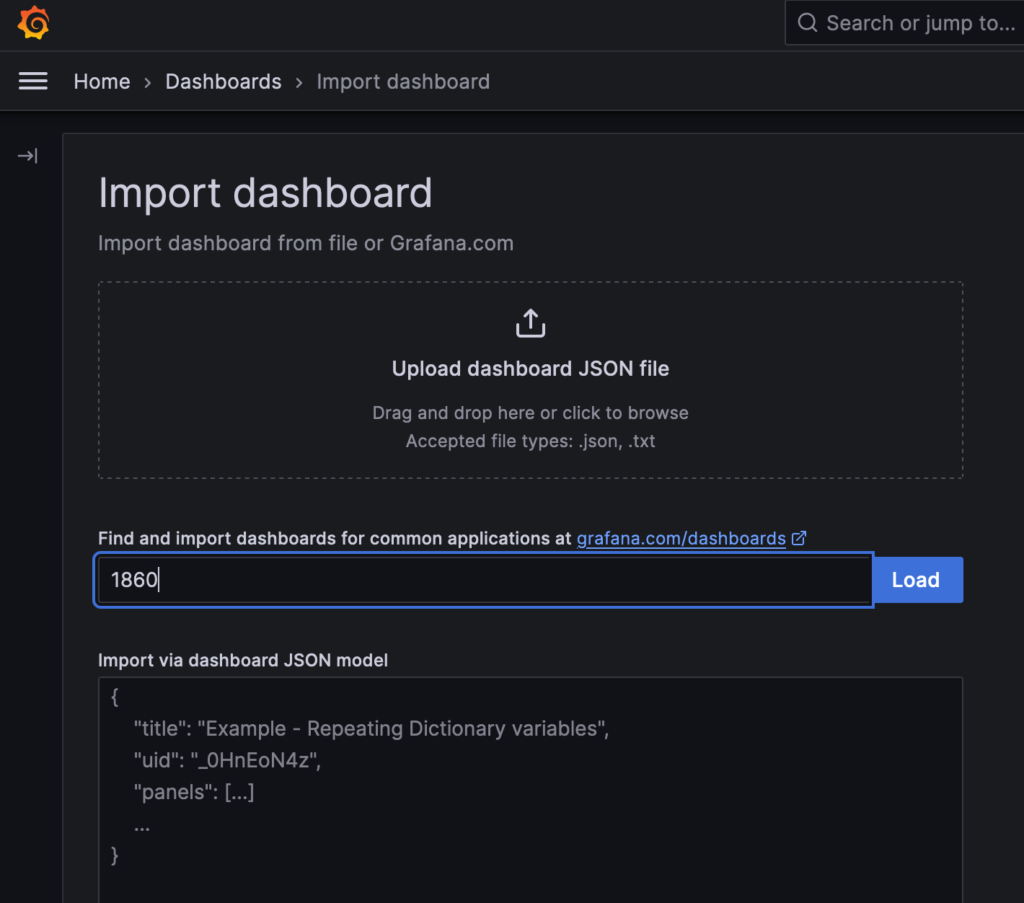
7. At the next screen, confirm the import details. Choose Prometheus as the data source and click the Import button.
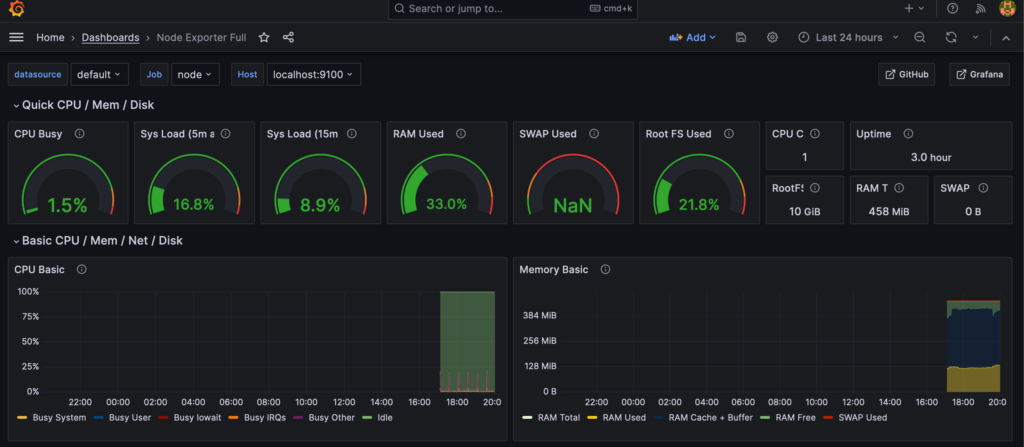
8. The Node Exporter Full dashboard takes effect immediately. It displays the performance metrics and state of the client node, including the Memory, RAM, and CPU details. Several drop-down menus at the top of the screen allow users to select the host to observe and the period to highlight.
Resources: