How to install Xdebug 3 with Docker & PhpStorm
Xdebug is a debugging tool for PHP. It provides step-debugging and a range of development helpers, such as stack traces, a code profiler, features to dump the complete execution of your script into a file, and more.
In versions of Xdebug before version 3, setting up step debugging for code inside Docker containers has often been challenging. However, in version 3, it has become almost trivial. In this short tutorial, I will walk you through the steps to set up your PhpStorm IDE with Docker.
Firstly, open our docker file, add the Xdebug extension, and enable it using the docker PHP ext allow command.
RUN pecl install xdebug \
    && docker-php-ext-enable xdebug
Now, rebuild our containers by running the docker-compose build command.
docker compose buildOnce installed, we can open the browser and see our var dumps look much better.
We can further verify that Xdebug is installed by executing the Xdebug info function, similar to PHP info.
<?php

xdebug_info();
Let’s refresh the page. Sure enough, we can confirm that the Xdebug is installed and enabled. As you can see, the step debugger and other features are not allowed here. Only the development helpers are allowed.
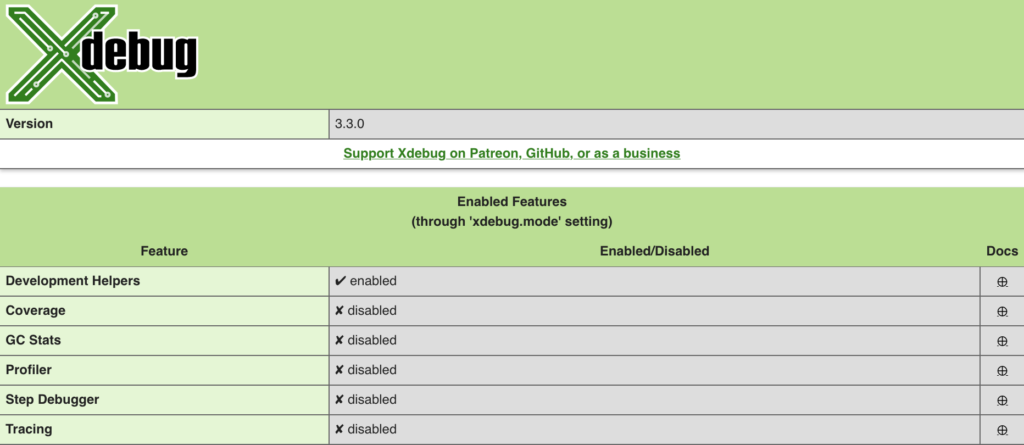
Xdebug has modes which enable different things. The default mode is the develop mode which basically overrides the look of vardump and errors and also provides some additional information and helpers. Xdebug can be customized via configuration settings. We can either add the configuration settings to the PHP ini file directly or we can create a separate ini file and copy it within the docker.
Xdebug configuration file example.
zend_extension=xdebug
xdebug.mode=develop,debug
xdebug.start_with_request=yes
xdebug.discover_client_host=0
xdebug.client_host=host.docker.internal
Go back to docker file and let’s copy our ini file to the correct PHP ini directory.
COPY docker/local/xdebug.ini "${PHP_INI_DIR}/conf.d/"There is one more thing you might need to do depending on your environment. For example if you are on linux you might need to define the docker internal host. So if we open our docker-compose.yaml file and define docker internal host via extra hosts option.
version: '3.0'
services:
  docker-test:
    container_name: docker-test
    build:
      context: .
      dockerfile: docker/local/Dockerfile
    networks:
      - docker-test
    ports:
      - '8080:80'
    volumes:
      - ./:/var/www
    extra_hosts:
        - 'host.docker.internal:host-gateway'
Let’s now rebuild our containers and then refresh our page to confirm that everything is working.
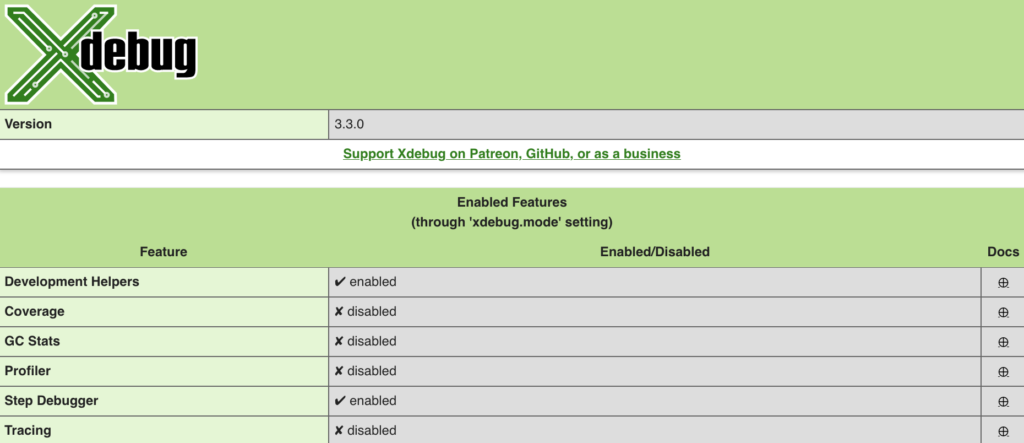
As you can see after refreshing the page the step debugger is now enabled. Allright so now we should be able to start debugging.
So let’s open PHPStorm settings and within PHP section we will click on the debug. Now in here we don’t really need to make any changes to the default settings other than settings this break at first line in PHP scripts to enabled.
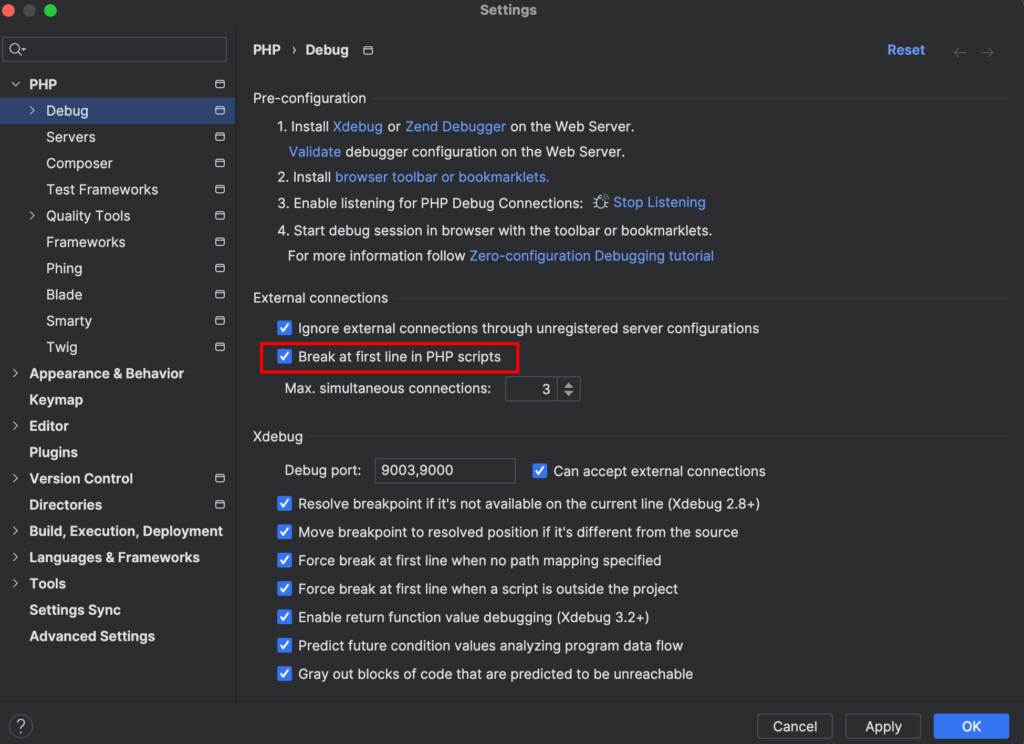
This basically allows the debugger to start debugging at the first line whenever the request comes in. We can then start listening to the actual debug connections by clicking start /stop listening button in (3) step in the screen.
Xdebug version 3 runs by default on port 9003. However xdebug version 2 war running on 9000 port by default.
Source: